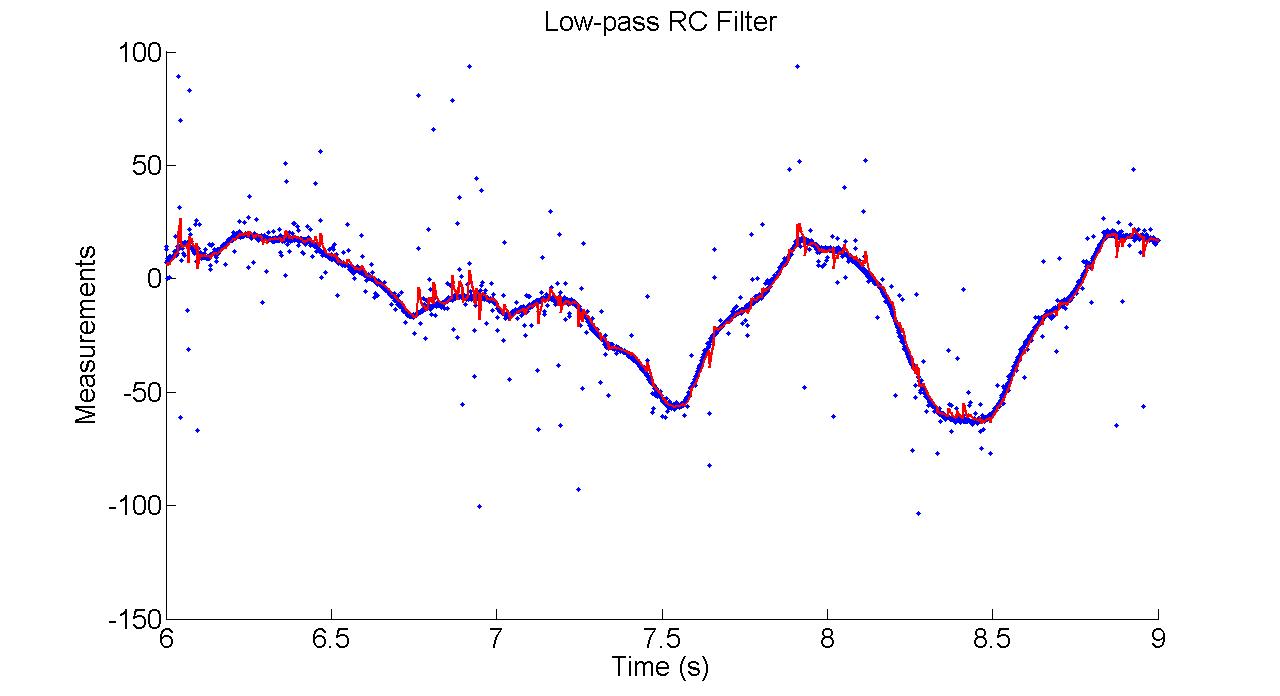
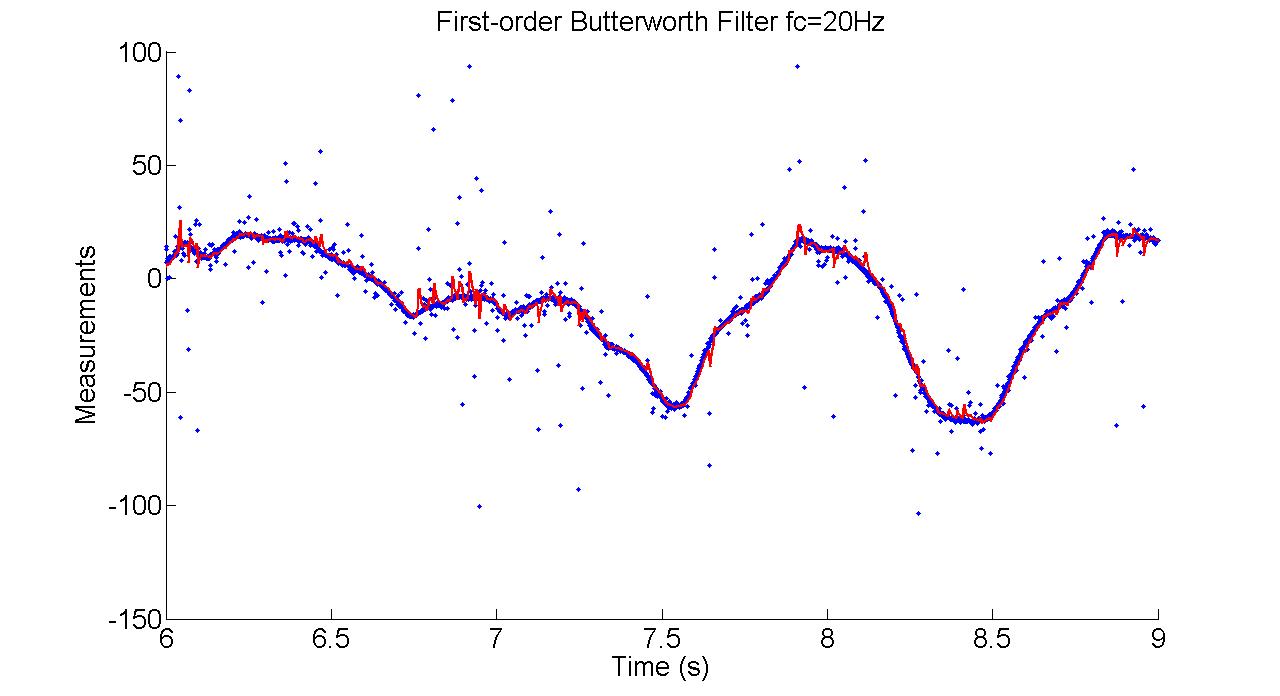
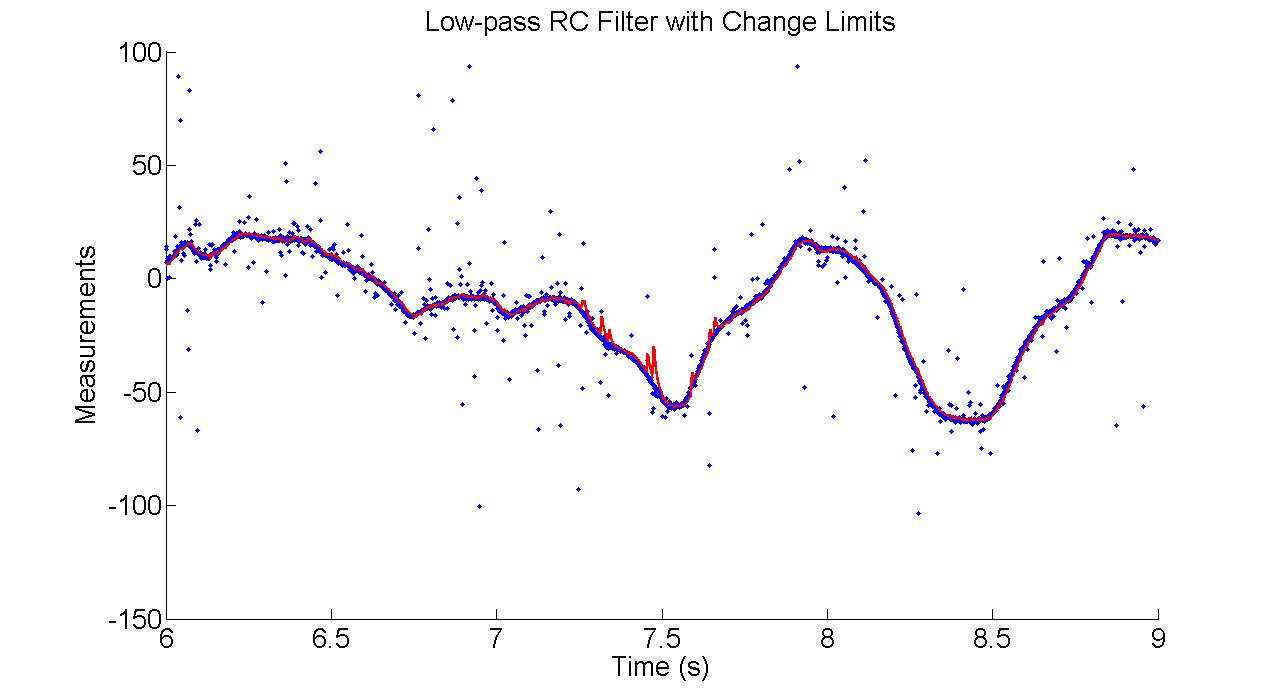
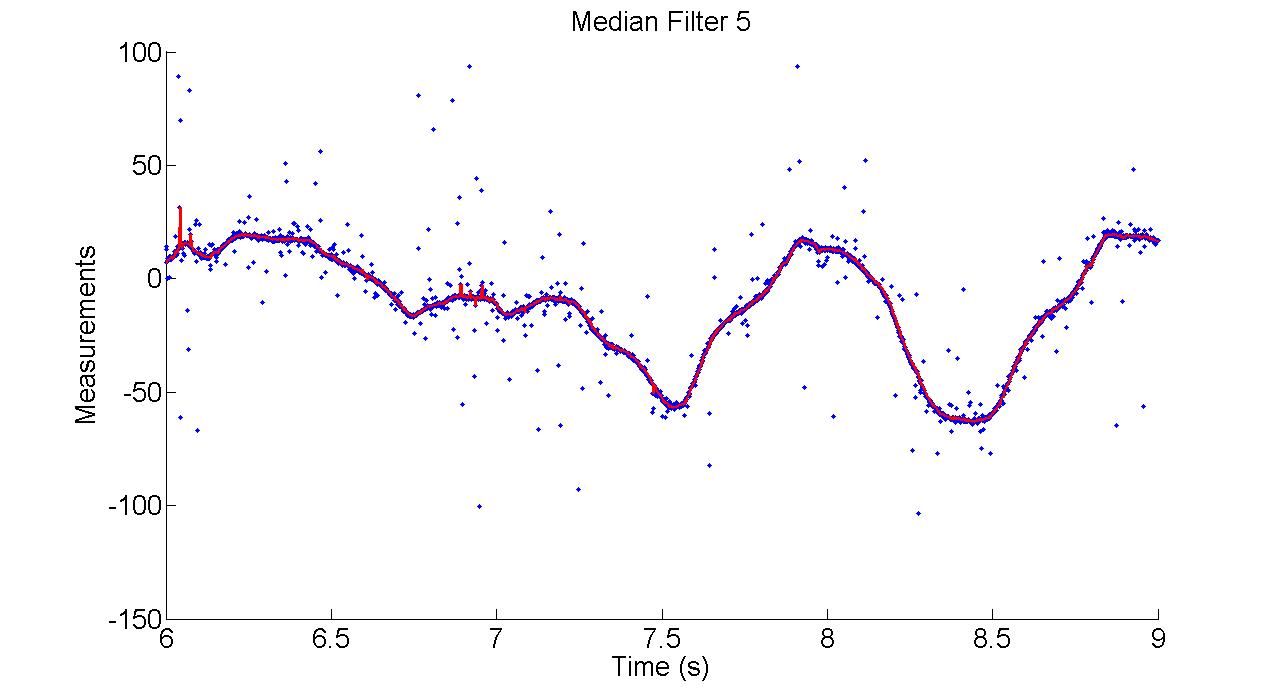
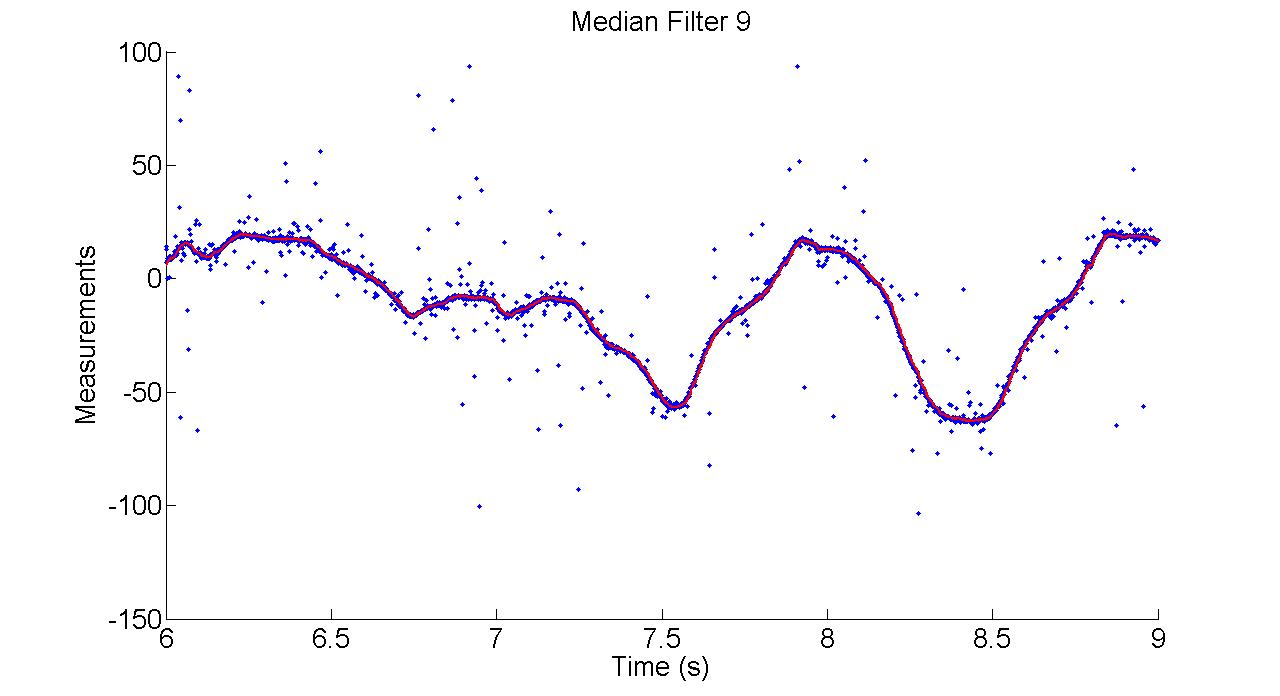
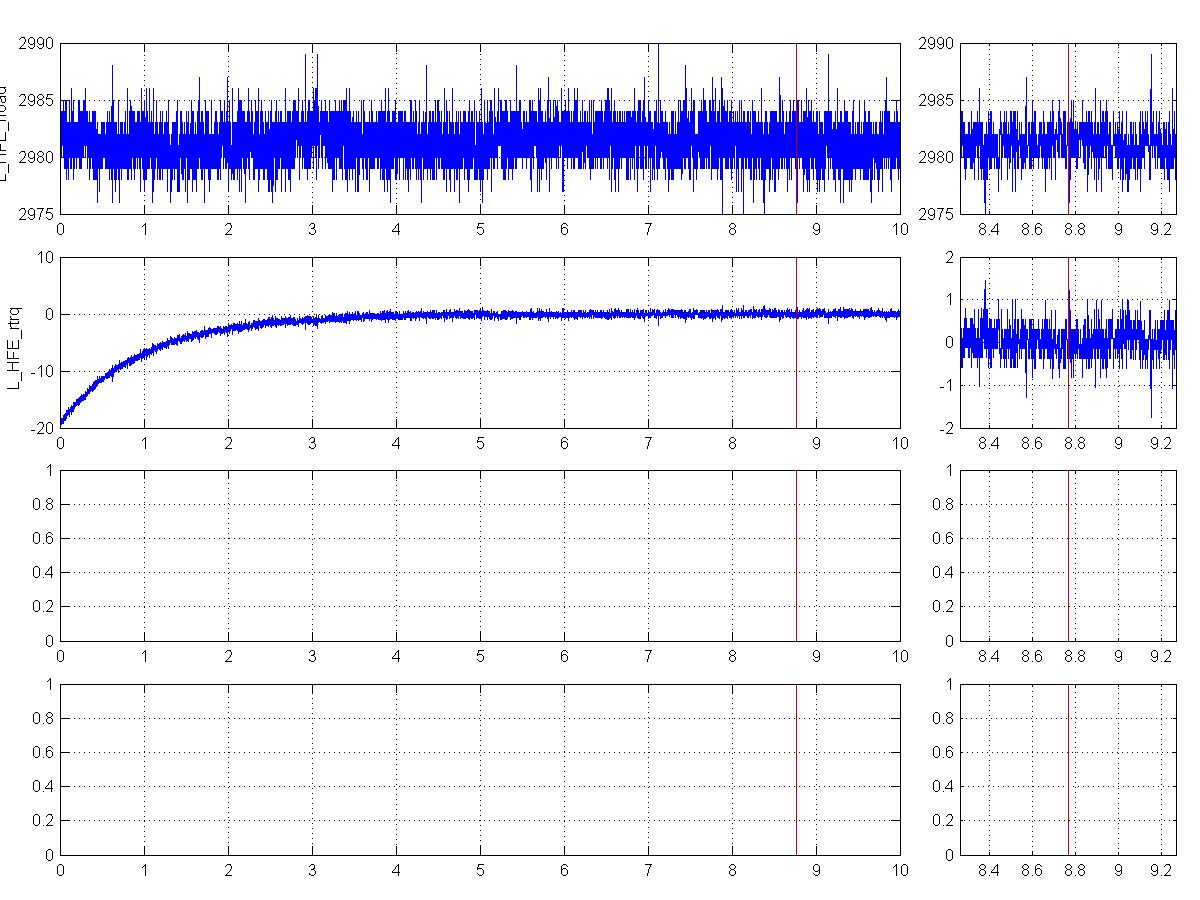
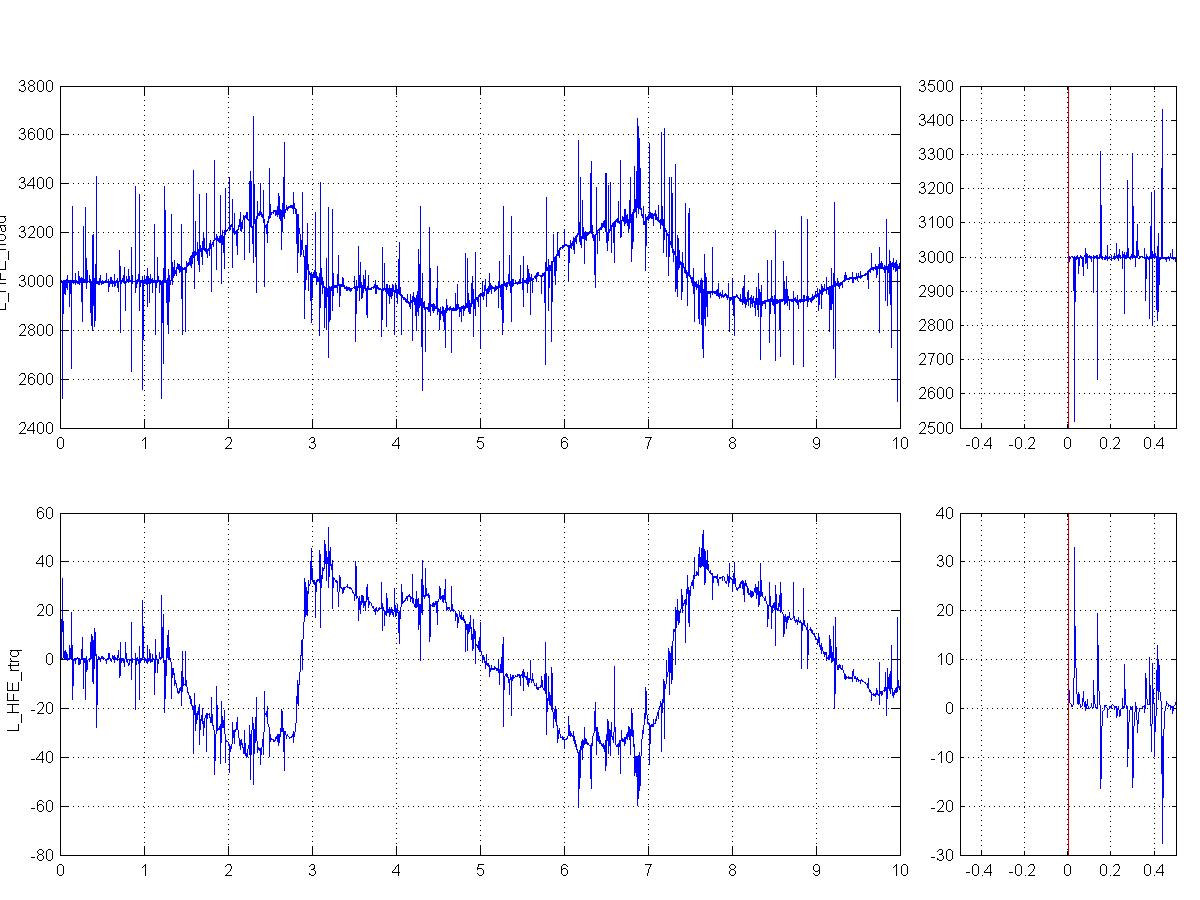
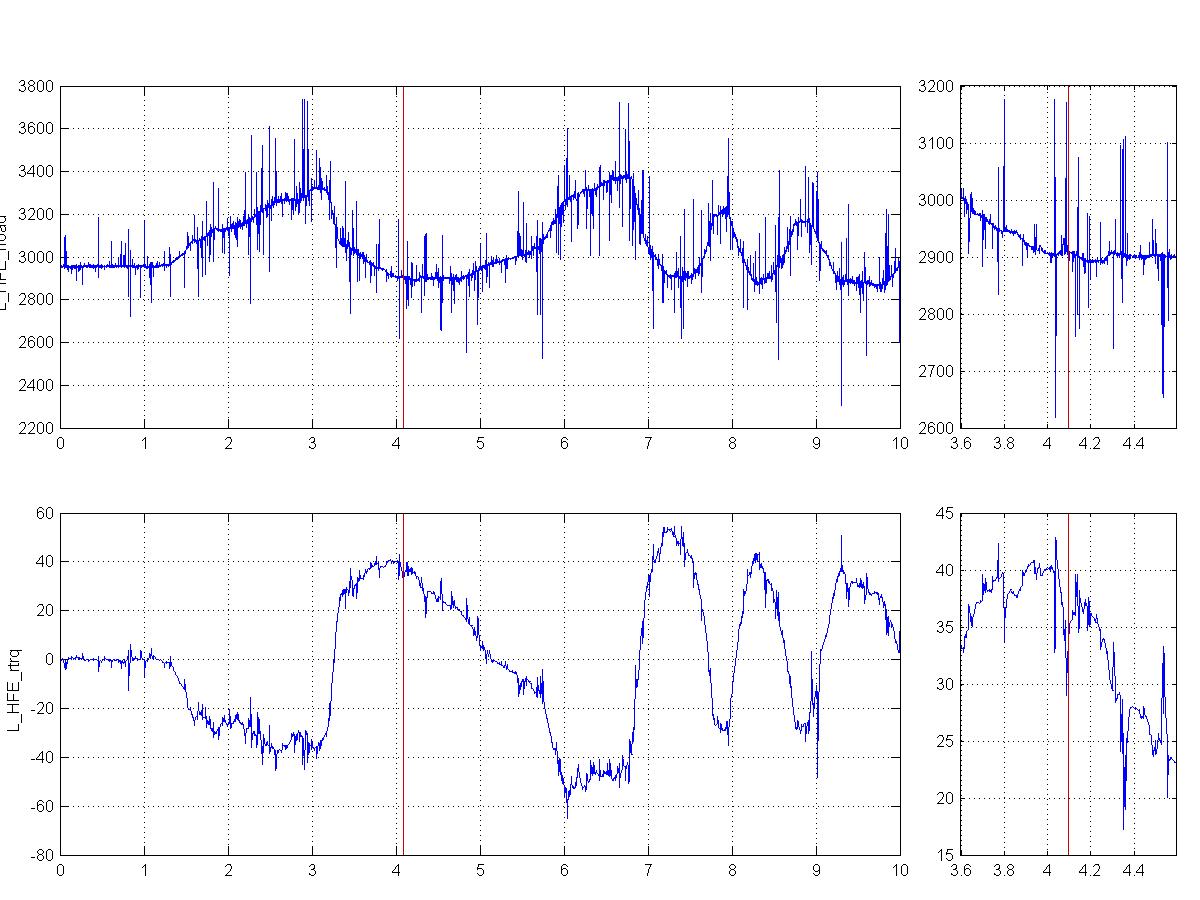
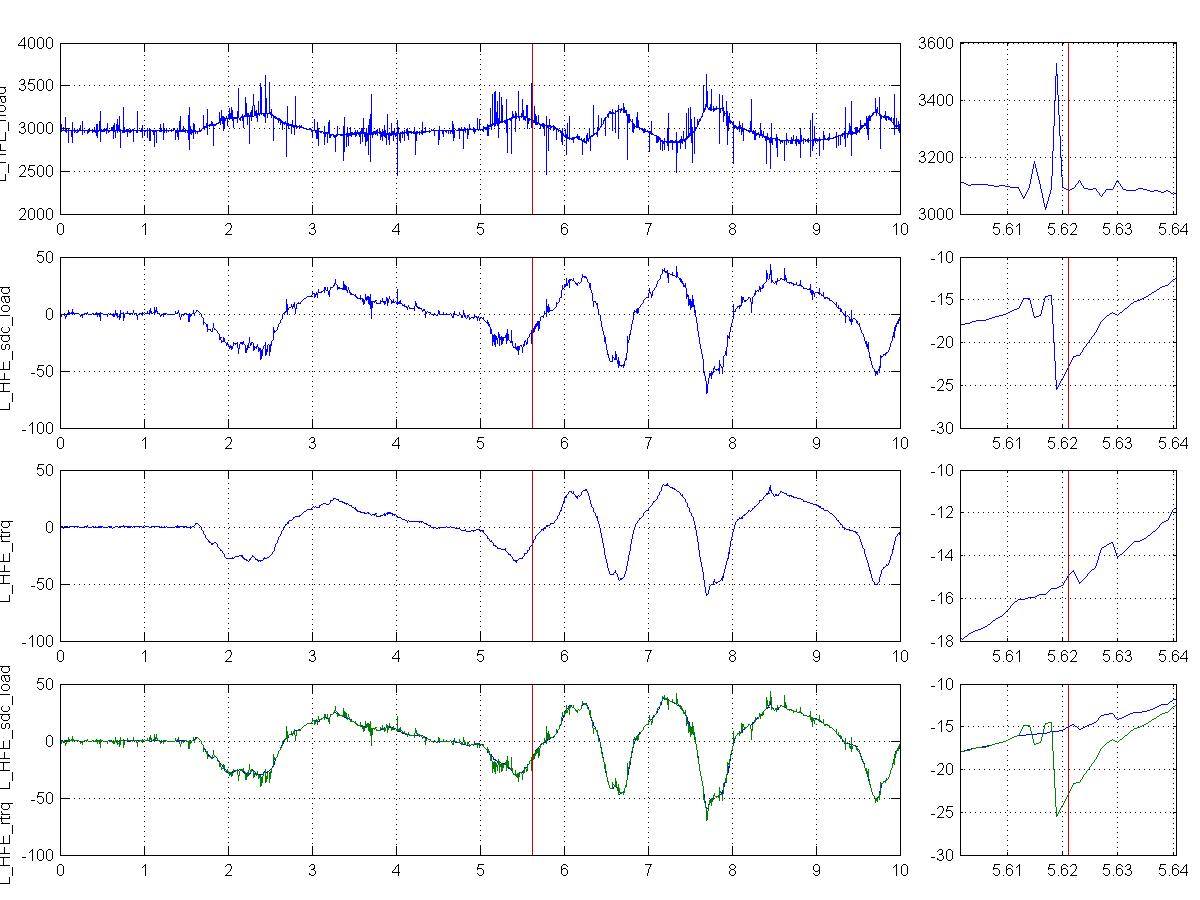
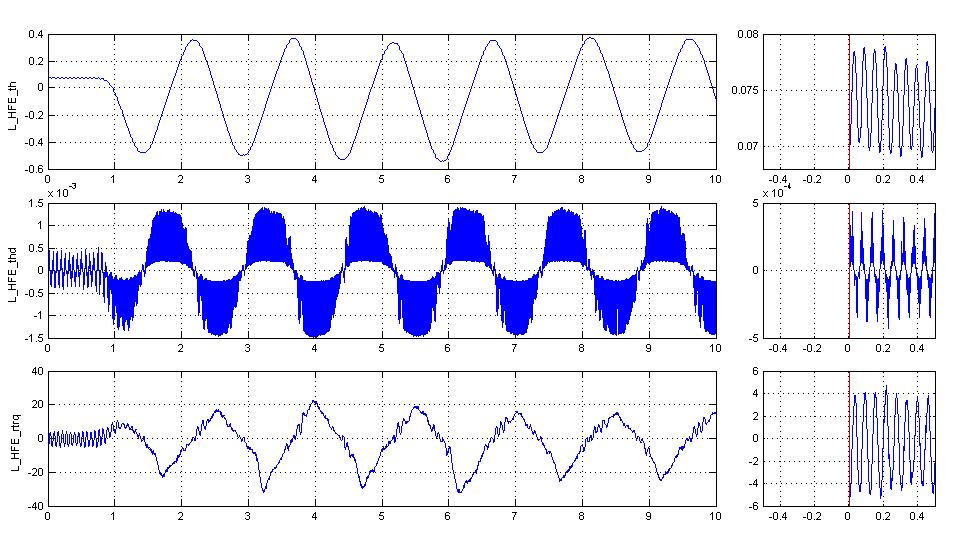
In th following figures, the blue dots are raw measurements and the red line is the filtered data.
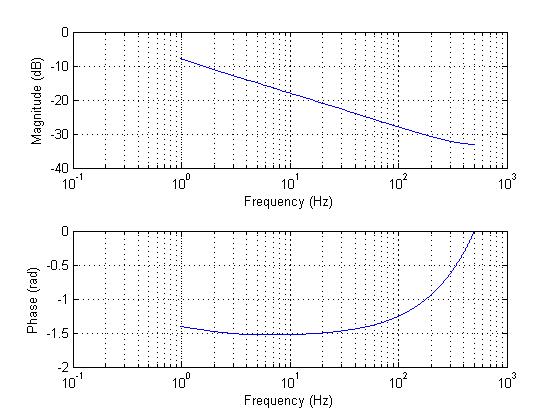
 alpha = 0.117
 b = [alpha 0]
 a = [1 -(1-alpha)]
Figure 1
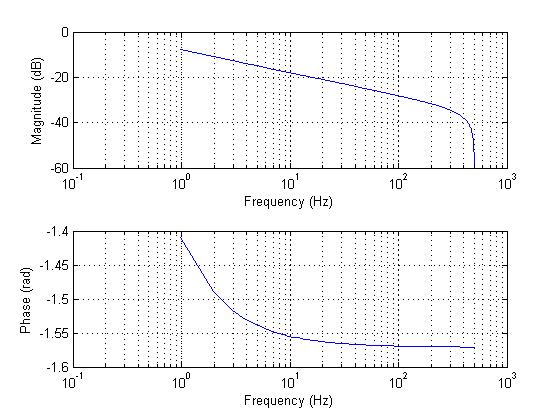
 b = [0.0592    0.0592]
 a = [1.0000   -0.8816]
Figure 2
 alpha = 0.117
 b = [alpha 0]
 a = [1 -(1-alpha)]
tmp2 = zeros(size(trq_raw));
for i=2:size(trq_raw,1)
   if abs(trq_raw(i-1)-trq_raw(i)) > 10
      tmp2(i) = tmp1(i-1);
   else
      tmp2(i) = trq_raw(i);
   end
end
y_rc_cl = filter(b,a,tmp2);
Figure 3
The low-pass RC filter considering change limits and the median filter of window width 9 give better results.
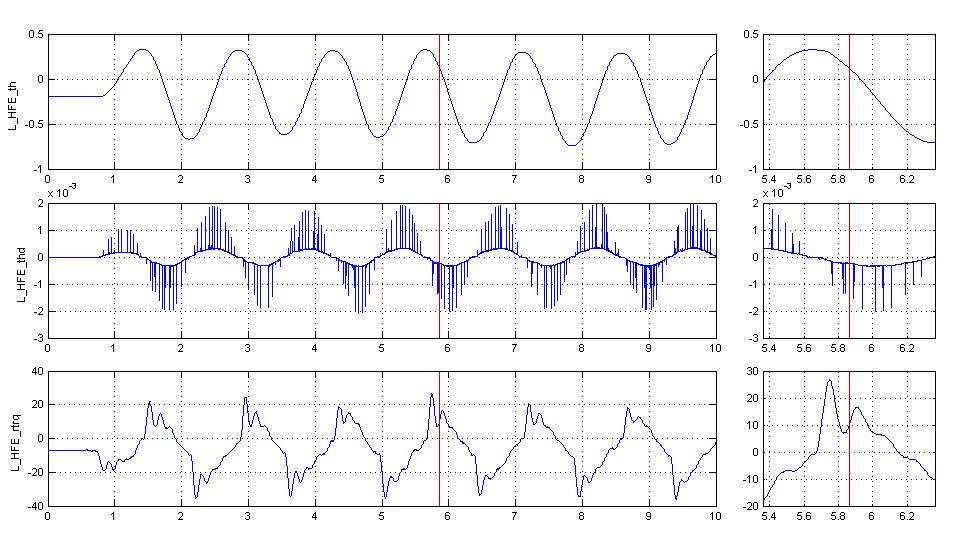
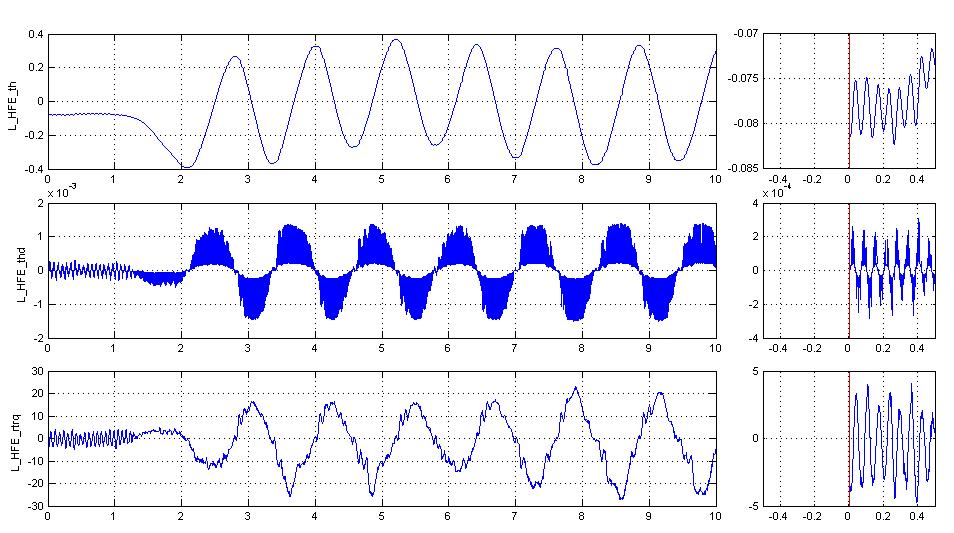
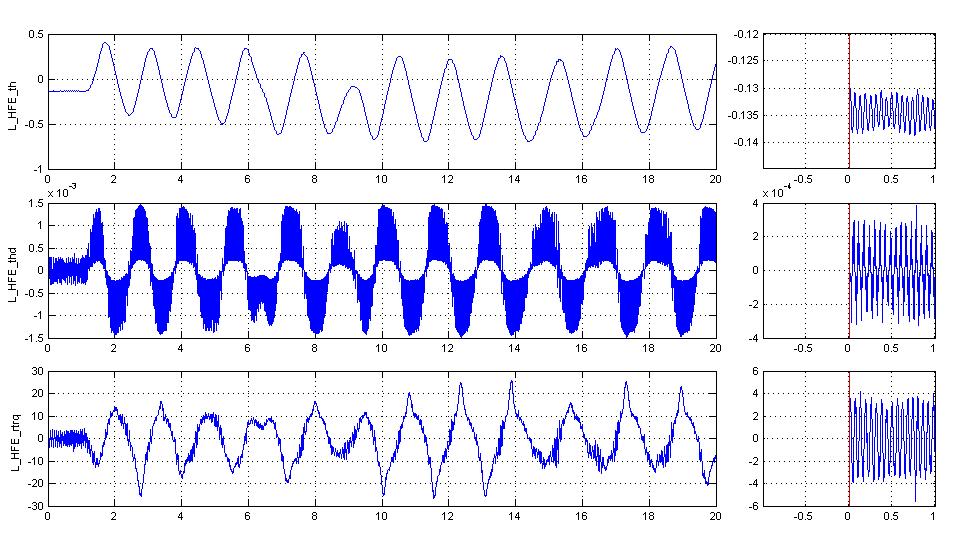
From above figures, we can find the large difference between the phase plots of them.
The bias of the button sensor measurements can be obtained by
adding a low pass filter when the joint angles are all about zero and static.
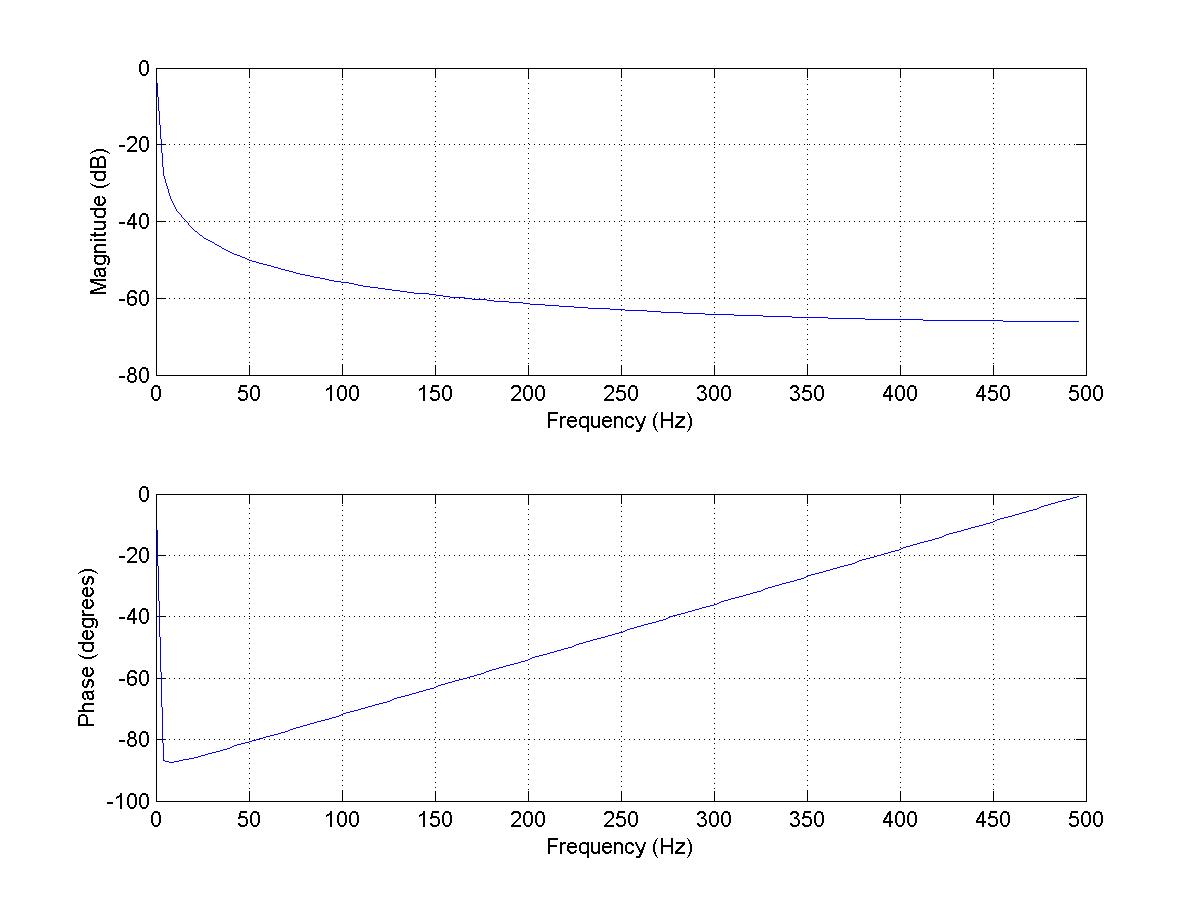
The following low pass filter is used
Bias[k] = Bias[k-1] + 0.001*(y[k] - Bias[k-1])where the cutoff frequency is 0.1593 Hz. The filter's frequency response
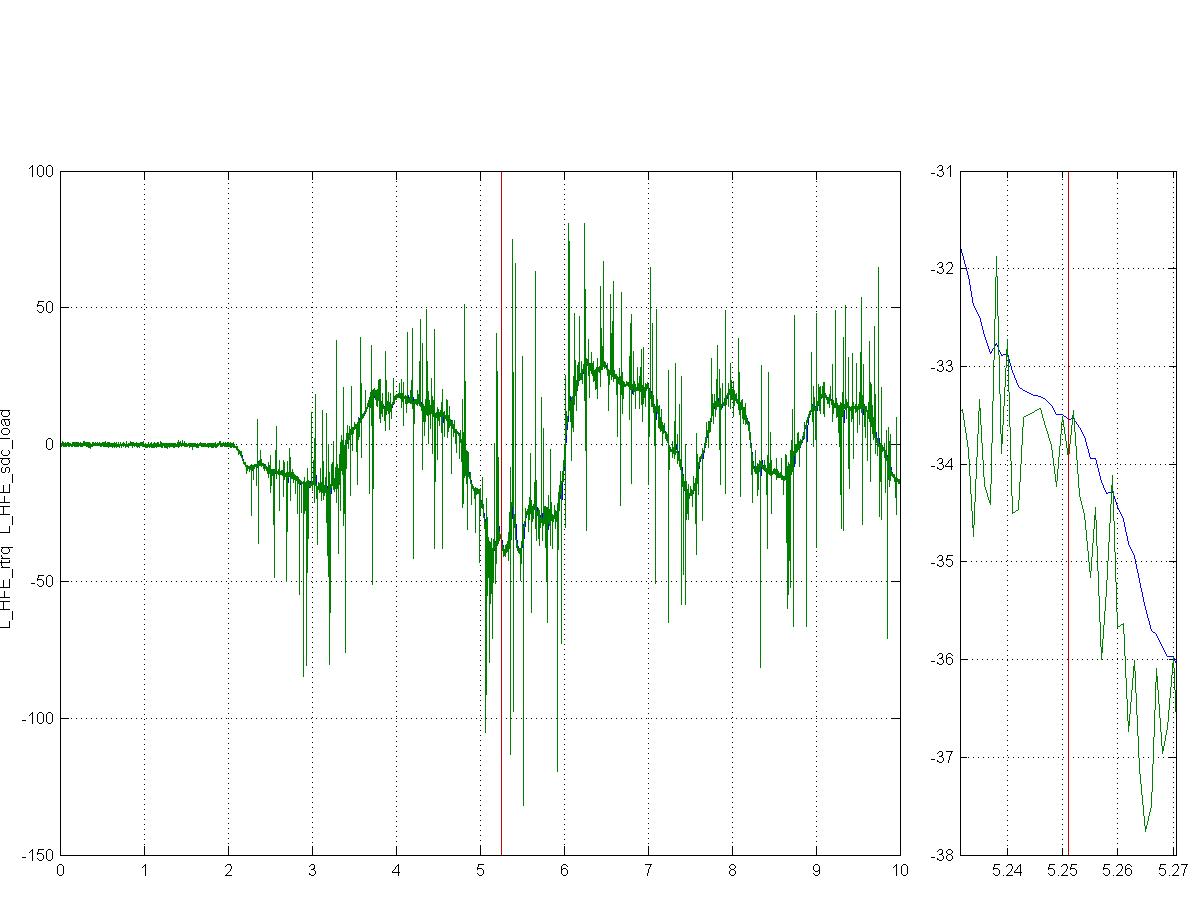
In the following experiments, the hip torque is calculated from the button sensor measurements.
fc = 20 comparison The green line is the raw measurements of the button sensor. The blue line is the hip torque after using this filter.
    if(fabs(trq_raw - raw[dofNum].trq) > 10){
    trq_raw = raw[dofNum].trq;
    }
The low pass filter with cutoff frequency 20 Hz and change limits can be used for the hip torque. Without the filter, we can not set torque feedback gain larger than 50 or it shakes severely. After adding the filter, we can set larger gain for torque control now.
Torque control is not good enough. I attribute this to the delay in the control loop. The delay may caused by the communication, sampling, the filter, and response time in high level program. Better torque control may be implemented at the DSP level.
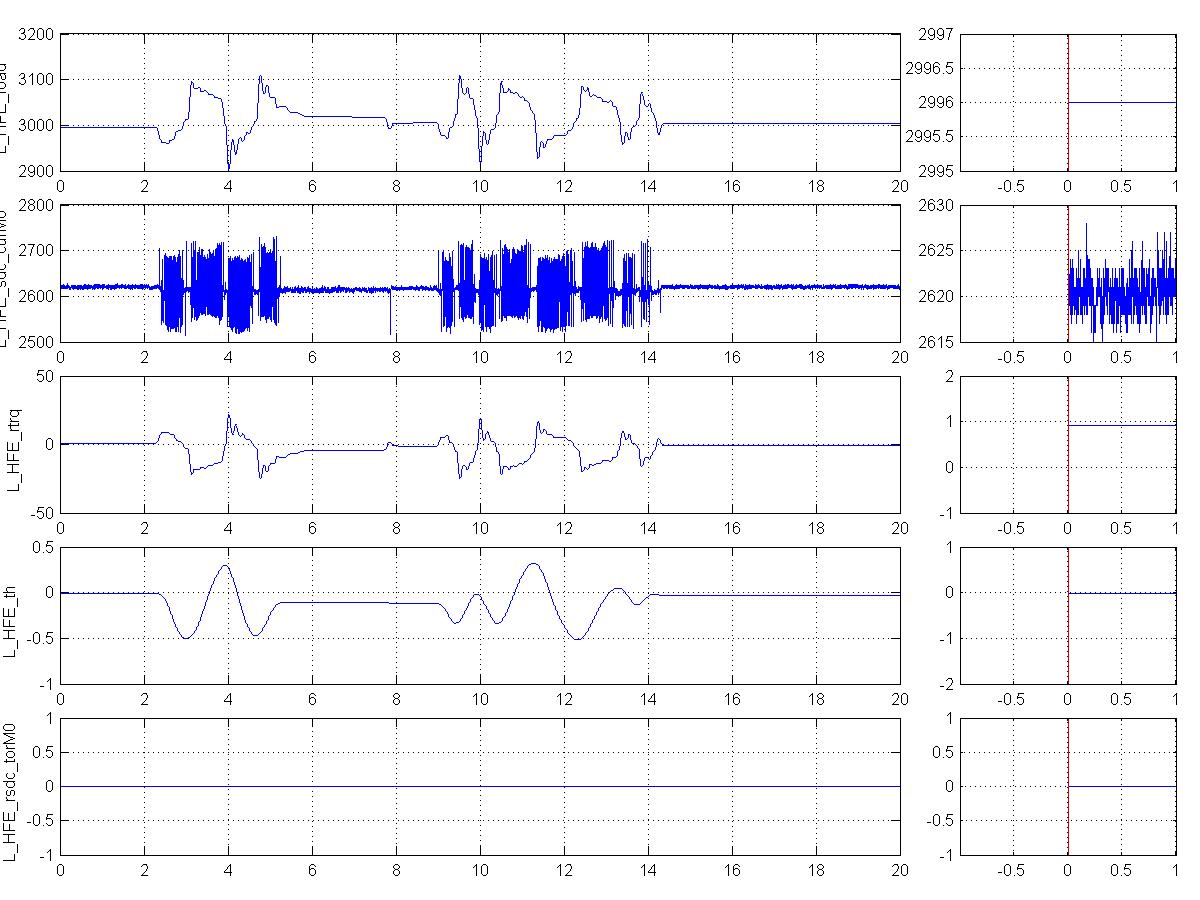
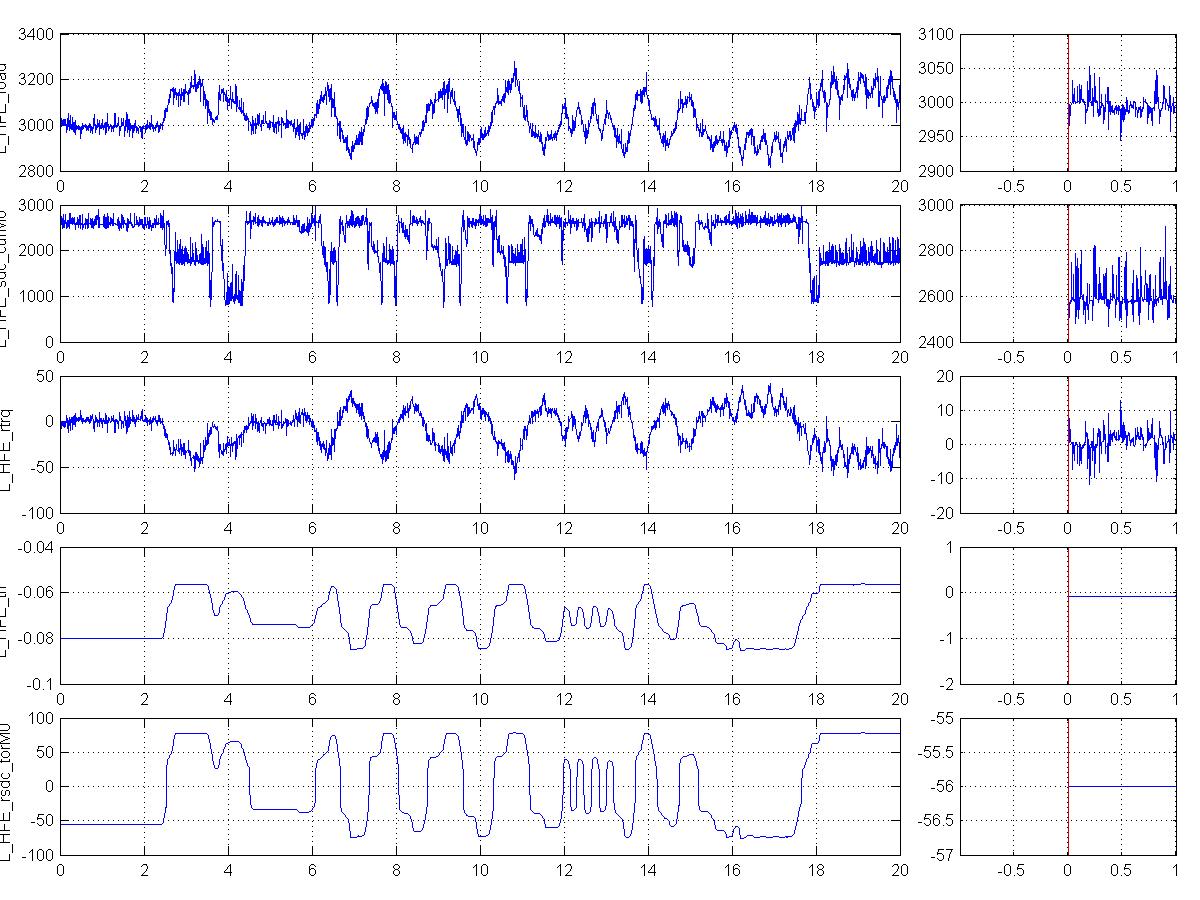
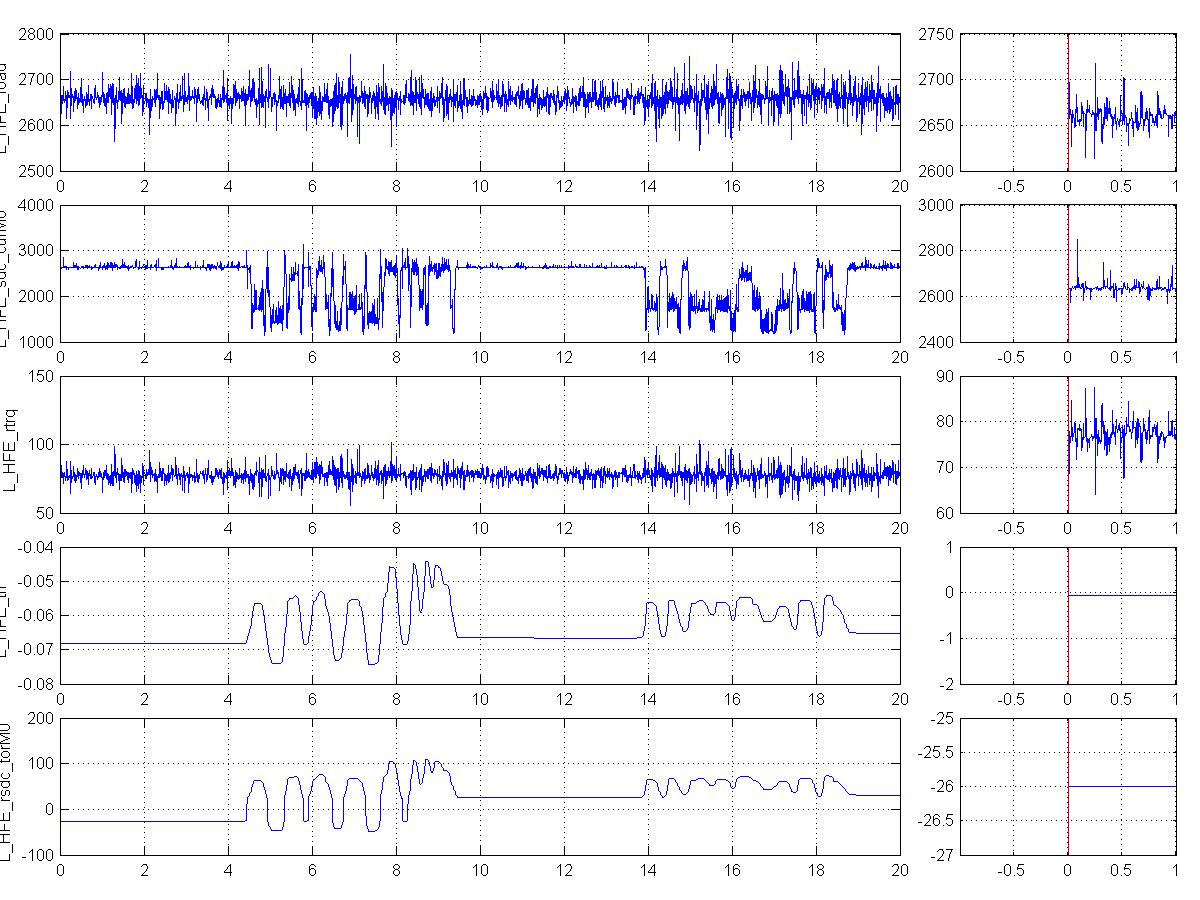
The figures below are for L_HFE_load, L_HFE_curM0, L_HFE_rtrq, and L_HFE_torM0
In Fig. 1, no motor commands are sent, the noise is small. In Fig. 2, motor commands are sent during position control, the noise is large. In Fig. 3, motor commands are sent during position control, the noise is still large although the sensor is disconnected.
The noise of button sensor is not introduced by the sensor, the cable between the sensor and DSP board, the movemoents of the leg, but by the DSP board. Filters should be added in the DSP code. Final solution may be a new partition for the DSP board design.
Date: 2009-03-25 02:08:29 Eastern Daylight Time
HTML generated by org-mode 6.14 in emacs 22